SIS Middle School Map: Understanding the U.S. Population
lesson
51 Downloads
Write a review
beta
EdBrAIn It
EdBrAIn uses AI to customize lesson resources for your students’ needs.

SIS Middle School Map: Understanding the U.S. Population

Share

Share On Facebook
Share On Twitter
Share On Pinterest
Share On LinkedIn
Email
Subject Math
Grade Level Grades 6-8
Attributes

About This Lesson

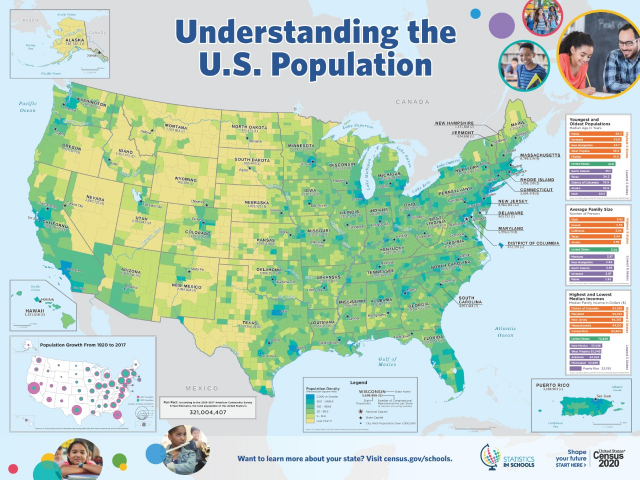
This map explains the U.S. population by providing data on the states with the youngest and oldest populations, the highest and lowest average family size, and the highest and lowest median income. The content in this map is best suited for middle school students.

Resources

Files

beta
EdBrAIn uses AI to customize lesson resources for your students’ needs.

OCDE-SEL-Toolkit_FINAL.pdf

March 2, 2021
2.15 MB

Reviews

Write A Review

Be the first to submit a review!

Advertisement