


About This Lesson
Ever wondered how to teach proportional relationships in an engaging way to your 7th and 8th grade students?
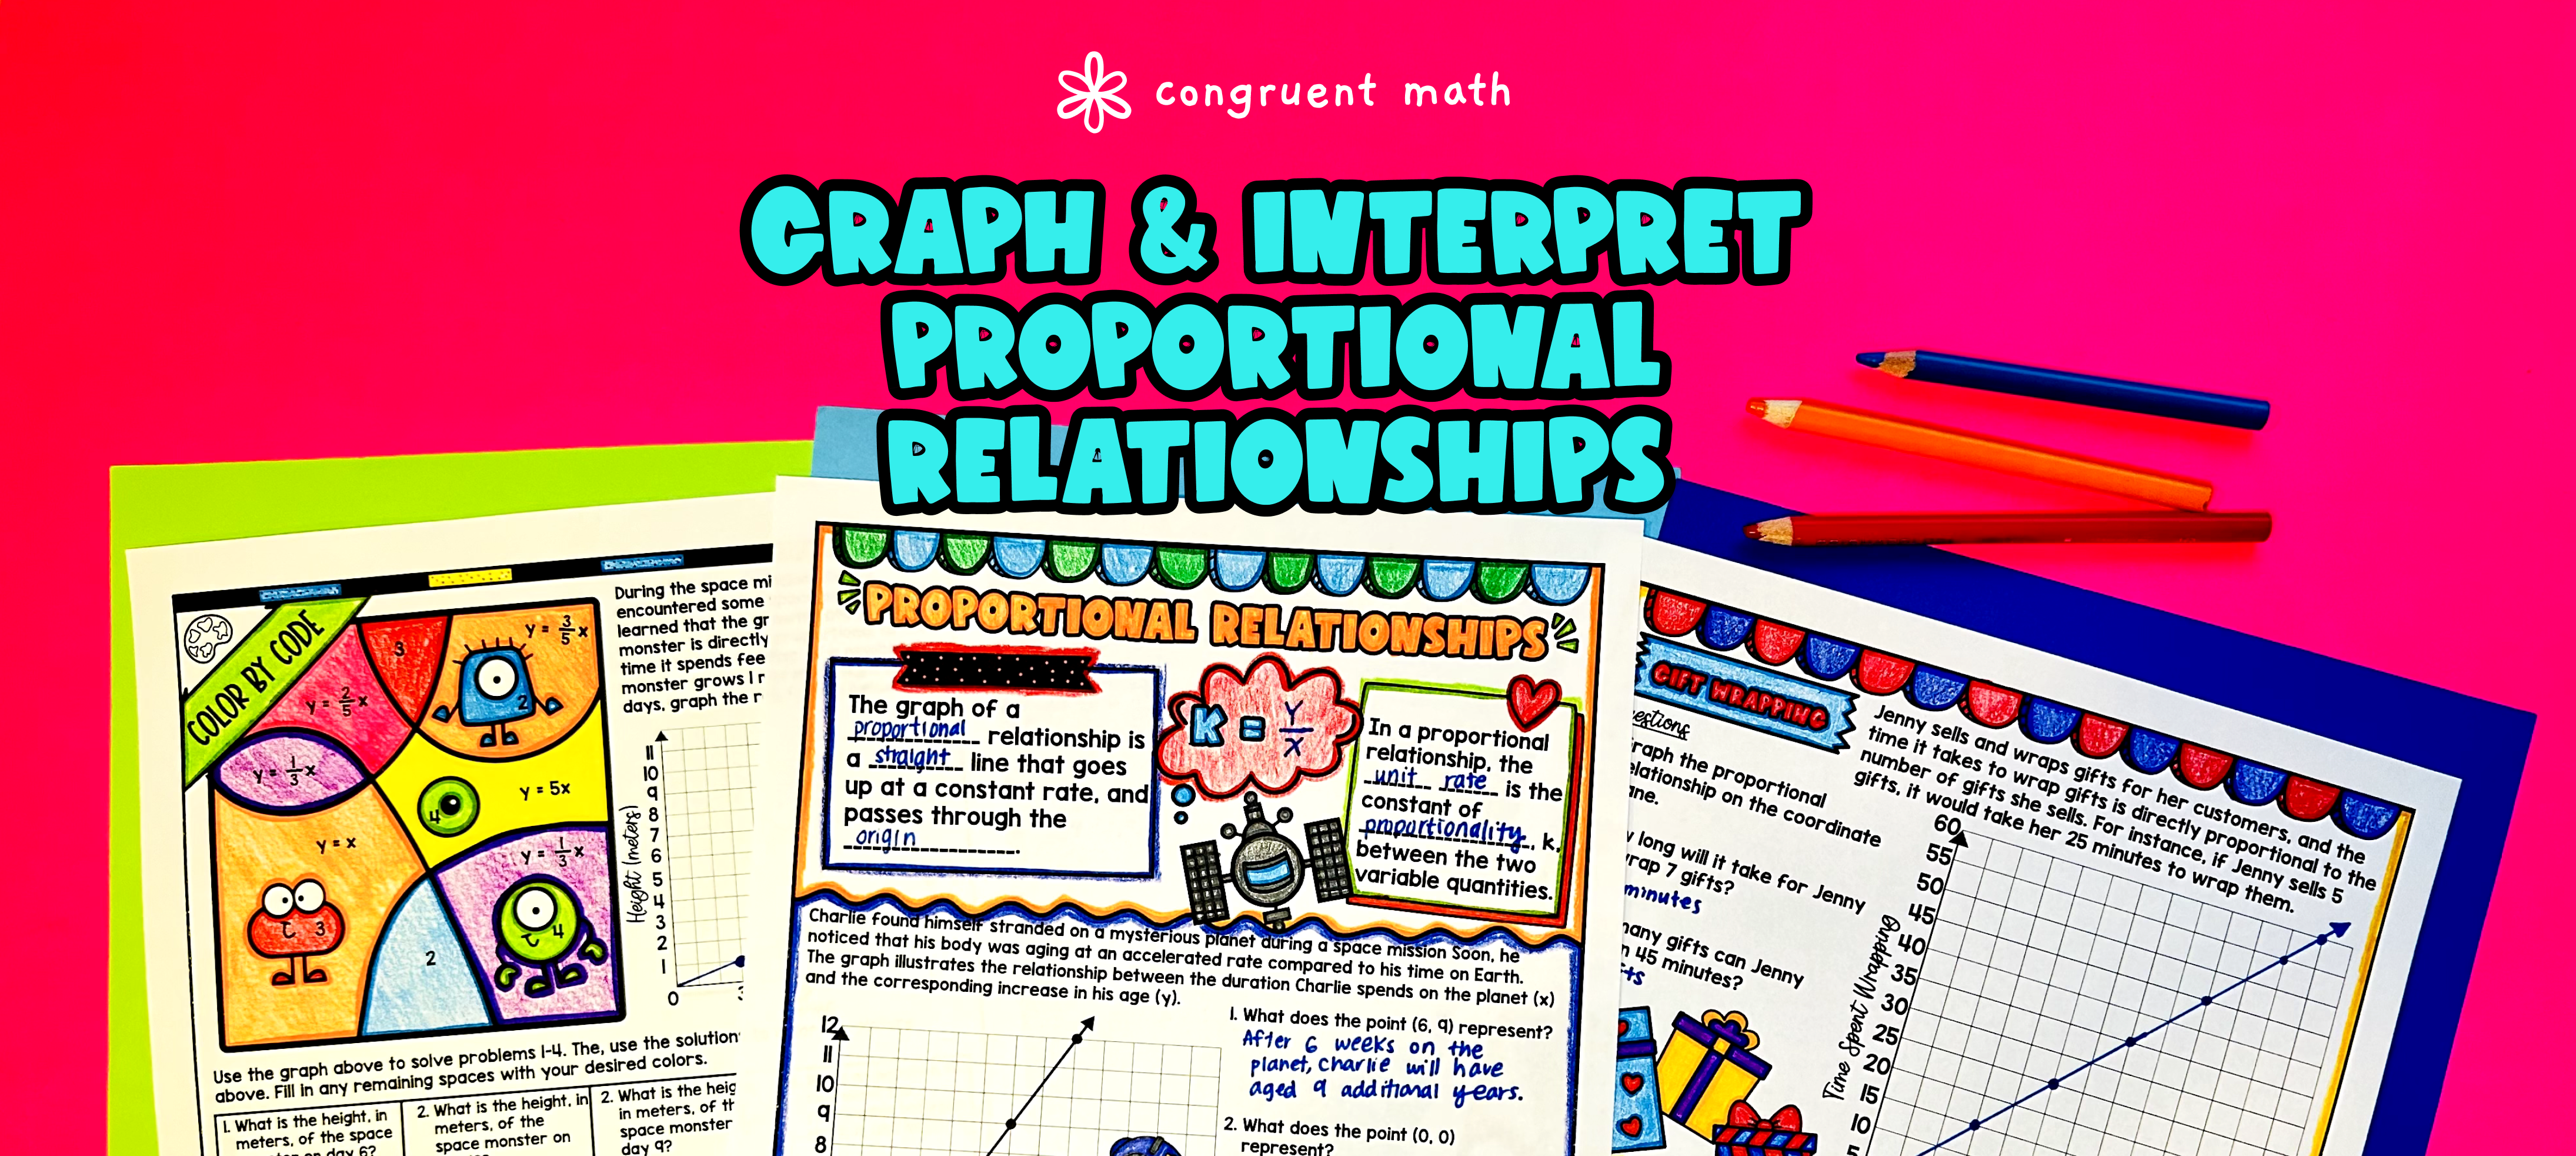
In this lesson plan, students will learn about representing proportional relationships through graphs and equations and explore their real-life applications. Then, they will also practice interpreting graphs of proportional relationships and understanding what the points represent in the context of the problem. Through artistic and interactive guided notes, checks for understanding, practice activities including a doodle & color by number worksheet, and a maze worksheet, students will gain a comprehensive understanding of proportional relationships.
The lesson culminates with a real-life application example that explores how proportional relationships are used in a practical context. Students will learn how to apply their knowledge of proportional relationships to solve real-world problems.


The lesson does not contain anything but a dead PDF. the next links take to a website and then to Techer pay Teacher to buy the products.